| Distance | Reaction time | Category |
|---|---|---|
| 2 cm | 64 ms | Excellent |
| 4 cm | 90 ms | Excellent |
| 6 cm | 111 ms | Excellent |
| 8 cm | 128 ms | Excellent |
| 10 cm | 143 ms | Excellent |
| 12 cm | 156 ms | Good |
| 14 cm | 169 ms | Good |
| 16 cm | 181 ms | Good |
| 18 cm | 192 ms | Good |
| 20 cm | 202 ms | Average |
| 22 cm | 212 ms | Average |
| 25 cm | 226 ms | Average |
| 28 cm | 239 ms | Average |
| 30 cm | 247 ms | Average |
Why distance equals reaction time
What makes the ruler drop work is a single unchanging equation of motion that every falling object obeys: d = ½ g t², in which d is the distance fallen, g is gravity (9.81 m/s²), and t is time. A ruler that falls further before you catch it means you took longer to react. Gravity being constant, those centimetres convert cleanly into milliseconds.
The same thing happens under the hood of this site's interactive Ruler Drop Test. Real elapsed time generates the falling distance through this very equation, which is then converted back to milliseconds for your score. So the numbers in the chart above don't approximate the test. They are the test.
Where the formula comes from
Begin with the equation of motion for an object released from rest: d = ½ g t². Since you measure d, the catch distance, and want t, your reaction time, rearrange for t. Doubling both sides gives 2d = g t², dividing by g gives t² = 2d / g, and taking the square root leaves t = √(2d / g).
Try it on a 12 cm catch (d = 0.12 m): t = √(2 × 0.12 / 9.81) = √0.02446 ≈ 0.156 seconds, or roughly 156 milliseconds. That single line of algebra is the whole test. Every row in the chart above is nothing more than this formula evaluated at another distance.
Run it with a real ruler
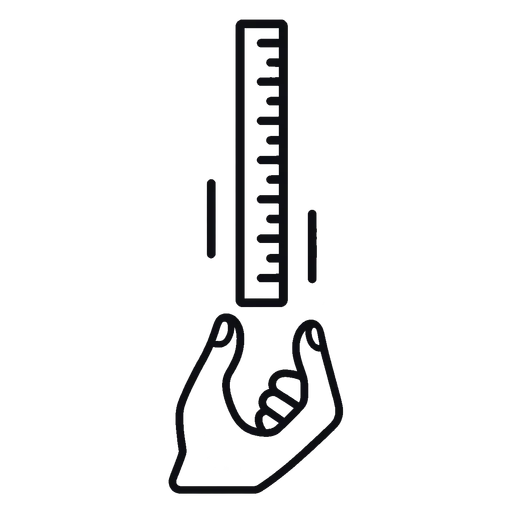
Have a partner pinch the top of a 30 cm ruler so its 0 cm mark hangs level with the gap between your open thumb and finger, which sit a few centimetres apart, ready but not touching.
Your partner releases the ruler without warning: no countdown, no verbal cue, no tell. Pinch as soon as you see it begin to fall, then read the centimetre mark immediately above your thumb. That is your catch distance.
Find that distance in the chart above, or work it out directly with t = √(2d / g). Take the best of several tries, because one flinch or a slow read of the mark can skew a single drop, and averaging or taking the median across attempts gives you a fairer number.
Where the name comes from, and what counts as a good catch
You will often see the classic version called the Nelson hand reaction test, named for Jack K. Nelson. Alongside Barry L. Johnson he co-authored Practical Measurements for Evaluation in Physical Education, a widely used physical-education testing textbook in which the ruler-drop protocol was formalized. Modern reliability research on this same test design rates it a workable but only moderately reliable single-session measure, which is precisely why coaches and teachers ask for several drops rather than one.
Catch-distance norms published in testing references land close to the categories in the chart above, although individual sources differ a little and reaction time varies naturally between people, and even between attempts by the same person.
| Category | Distance | Reaction time |
|---|---|---|
| Elite | < 11 cm | < 0.15 s |
| Excellent | 11–16 cm | 0.15–0.18 s |
| Good | 16–24 cm | 0.18–0.22 s |
| Average | 24–44 cm | 0.22–0.30 s |
| Below average | > 44 cm | > 0.30 s |
Beyond the basic drop
Adaptability is part of why the ruler drop has held its place in school science and PE lessons for decades. Add a choice-reaction twist by having the dropper call "catch" or "don't" at the moment of release, forcing the student to decide as well as react. To study fatigue, measure before and after exertion. To study distraction, have the student count backwards while catching.
Across a whole class, average several drops per student to smooth out flukes and record the results against age. Younger students get to watch their own numbers improve across a term, which makes the general trend of reaction time improving through childhood tangible inside one classroom experiment.
Sources of error
Anticipating the drop tops the list. Watching the dropper's hand or shoulder for a tell inflates the score, because the student starts moving before the ruler actually falls. Droppers should vary their timing and give no warning, verbal or physical.
Running a close second is fingers that are already moving. Pinching pre-emptively measures anticipation instead of reaction, so keep the catching hand relaxed and still until the ruler is genuinely falling.
Third comes simple measurement error: reading the wrong mark, or reading it inconsistently from one attempt to the next. Read where the top edge of the thumb catches the ruler, the same way every time, since a centimetre of reading error buys several milliseconds of "reaction time" that never happened.
- 01Johnson, B. L., & Nelson, J. K. (1986). Practical Measurements for Evaluation in Physical Education (4th ed.). Macmillan.
- 02Ferreira, S., Raimundo, A., del Pozo-Cruz, J., Leite, N., Pinto, A., & Marmeleira, J. (2024). Validity and reliability of a ruler drop test to measure dual-task reaction time, choice reaction time and discrimination reaction time. Aging Clinical and Experimental Research, 36(1), 61. Ferreira, S., Raimundo, A., del Pozo-Cruz, J., Leite, N., Pinto, A., & Marmeleira, J. (2024). Validity and reliability of a ruler drop test to measure dual-task reaction time, choice reaction time and discrimination reaction time. Aging Clinical and Experimental Research, 36(1), 61.
- 03Top End Sports. Reaction Time Calculator: Ruler Drop Test & Athletic Performance. Top End Sports. Reaction Time Calculator: Ruler Drop Test & Athletic Performance.